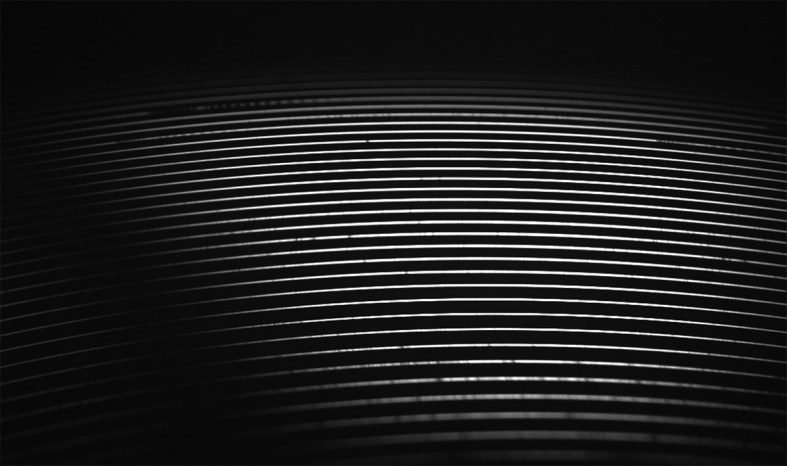
Over the past few weeks, the high resolution spectrograph was down due to our working on installation of a new control PC and the replacement of the imaging fiber. The spectrograph is an Echelle design, utilizing a grating design that overlaps 50+ orders of spectra before then being split out into separate rows on an CCD image. The raw spectra image looks like a series of curved lines, but the software does its magic, sorts out which row is which and then reconnects them all into one long, high resolution spectra.
sol1
The wavelength calibration is done using a Thorium Argon lamp at the observatory. This lamp generates many well-known emission lines that the spectrograph software then uses to set wavelength values to the spectra of objects being studied. The ThAr spectrum is below with the spectral orders labeled and the identified emission lines wrapped in green boxes.

ThAr
Once the software has all this figured out, each row is calibrated for wavelength and intensity and is saved in a tremendous FITS file. Below is one small piece of that FITS file for our Sun, the region around 656.3nm, the Hydrogen-alpha line:

H Aplha
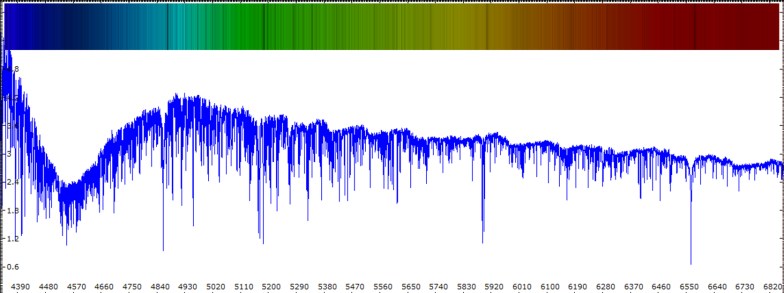
Compressed to fit the screen here is a spectrum of our sun (actually clouds above our observatory, because imaging the sun directly would be the last thing we’d want to do with this device!). The image has been saved from Shelyak Instruments EShel software and calibrated within VSpec software. Wavelengths are in ångströms. The violet side shows that we have to work on radiometric correction for the instrument…. in progress 😉
sol_eshel_2016-02-13


